使用matplotlib生成动态图并保存gif文件
最近对机器学习开始感兴趣,已经学完了python的基本知识,开始详细研究各种工具以及算法。
今天做了一个快速排序的动态示意图,基本开发过程记录一下。
import matplotlib.pyplot as plt
import matplotlib.animation as animation
import copy

results = []

# 快速排序算法
def parttion(v, left, right):
    key = v[left]
    low = left
    high = right
    while low < high:
        while (low < high) and (v[high] >= key):
            high -= 1
        v[low] = v[high]
        while (low < high) and (v[low] <= key):
            low += 1
        v[high] = v[low]
        v[low] = key
    return low
def quicksort(v, left, right):
    if left < right:
        p = parttion(v, left, right)

        # 这里要采用浅拷贝方法,将每次运行结果保存到list中
        global results
        copyList = copy.copy(v)
        results.append(copyList)

        quicksort(v, left, p - 1)
        quicksort(v, p + 1, right)
    return v

# 设置初始值并执行算法
start = [10, 8, 1, 4, 3, 9, 5, 12, 11, 2, 7, 15, 6]
s = [10, 8, 1, 4, 3, 9, 5, 12, 11, 2, 7, 15, 6]
l = len(s)
quicksort(s, left = 0, right = l - 1)

# 画图开始
fig = plt.figure()
ax = fig.add_subplot(111)
# 柱状图关键在于这句话
rects = plt.bar(left=(range(l)), height=(start), width=0.4, align="center", yerr=0.000001)
# 柱状图加入下标
plt.xticks((range(l)), start)

#如果是参数是list,则默认每次取list中的一个元素,results[0],results[1],...
def update(data):

    # 将上一次的柱状图清空
    plt.cla()

    rects = plt.bar(left=(range(l)), height=(data), width=0.4, align="center", yerr=0.000001)
    plt.xticks((range(l)), data)
    return rects

# 生成动态图的关键语句
ani = animation.FuncAnimation(fig, update, results, interval=2*1000)

# 利用ImageMagick导出
ani.save('perceptron.gif', fps=2, writer='imagemagick')
首先下载ImageMagick,下载地址:http://www.imagemagick.org/script/download.php
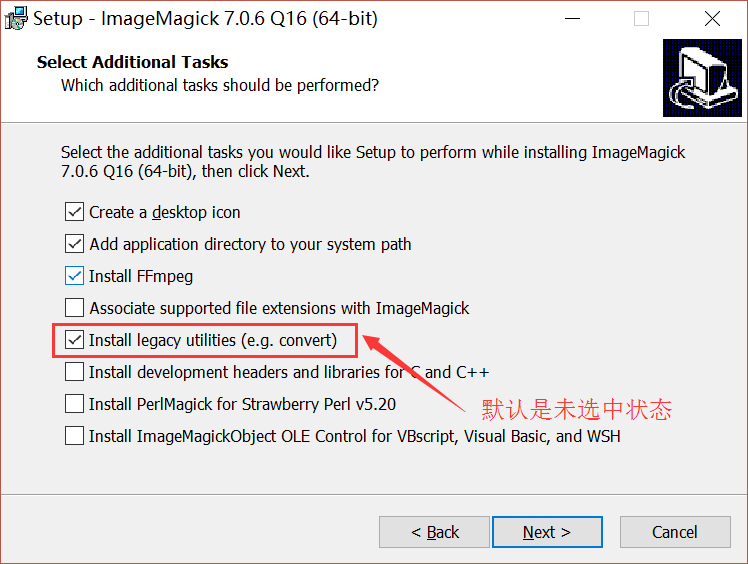
安装的时候注意一个选项必须选中:
python2.7版本必须修改matplotlib的配置文件,配置文件地址通过以下命令查询:
import matplotlib
matplotlib.matplotlib_fname()
将matplotlibrc文件最后一行#animation.convert_path: ‘convert’的注释打开,并将convert修改为ImageMagick安装路径下的convert.exe文件。
但是python3.5只要安装了ImageMagick,什么也不用改就好使了。